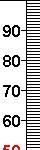
How to read the graph The graphical profile your web site gets is the most important part of the WAMMI report. It shows the average values your site gets for the five WAMMI scales: Attractiveness, Controllability, Efficiency, Helpfulness,and Learnability. The Global Usability Score (GUS) is a weighted composite of statements from each of the five scales.
If your web site is above the average (50) for any scale according to the database this is indicated by a green bar extending upwards from the '50' line. If your site has scored below average on a scale, this is indicated by a red bar extending downwards from the '50' line. If the bar is below 30 or above 70 this means that your site is exceptional on that scale.
Explanation of the WAMMI Scales -
- Attractiveness
- An Attractive site is visually pleasant, and also offers much of direct interest to the respondents, whether it be functionality or information.
Controllability- If a site scores well on Controllability the respondents most probably feel they can navigate around it with ease and do the things they want to do. Poor usually means a poorly organised site that disrupts the way they normally expect to do things.
Efficiency- When respondents give a high Efficiency rating they feel they can quickly locate and do what is of interest to them in a effective and economical manner. They feel that the web site responds (possibly, the pages load) at a reasonable speed.
Helpfulness- A site which is high on Helpfulness corresponds with the respondents' expectations about its content and structure. A site low on Helpfulness can be misleading about its layout and content.
Learnability- When Learnability is high, respondents feel they are able to start using the site with the minimum of introductions. Everything is easy to understand from the start. When Learnability is low, respondents feel that the site may be using concepts or terminology which are unfamiliar. More explanations are needed.
Global Usability Score (GUS)- Global Usability centres round the concepts that a site must make it easy for respondents to access what they need or want from the site, that there is a good, understandable level of organisation, and that the site 'speaks the respondents language' and meets their expectations.
|